EV market statistics
Published February 27, 2026
- The UK’s new car market grew 3.4% YoY in January 2026, reaching 144,127 registrations, marking a positive start to the year despite continued cost and supply pressures.
- BEVs recorded 29,654 registrations, giving them a 20.6% market share (up 0.1% YoY), the lowest recorded since April 2025.
- Electrified vehicles (BEVs, PHEVs, and HEVs) made up around 47% of new car registrations, highlighting the continued shift away from petrol and diesel.
- PHEVs were the strongest-growing segment (up 47.3% YoY), reaching 18,557 units, while petrol and diesel registrations declined further, signifying an accelerating transition toward electric motoring.
Our updated EV market guide is a trusted reference for automotive journalists, industry professionals, and car buyers, bringing together the latest registration data, market trends, and expert analysis.
You can also read our broader UK car market statistics guide.
Glossary of EV terms
YoY: Year-on-year
Powertrain: This is the system responsible for generating a vehicle’s power - and transferring it to the road.
Market share: In the context of these guides, ‘market share’ refers to the share of cars sold over a specified period, rather than share of the overall car parc.
EV: Electric vehicle
BEV: Battery electric vehicle
PHEV: Plug-in hybrid electric vehicle
HEV: Hybrid electric vehicle
MHEV: Mild hybrid electric vehicle
ICE: Internal combustion engine
ZEV: Zero emission vehicle
SMMT: Society of Motor Manufacturers and Traders
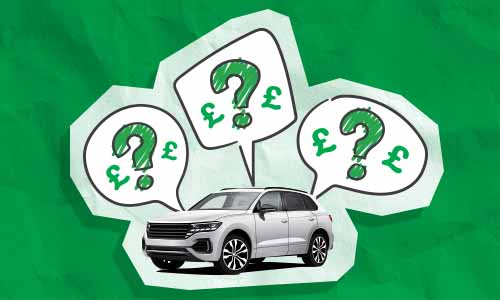
Get a free valuation
The current state of the new EV market
| Powertrain | January 2026 | January 2025 | % change | Market share ‘26 | Market share ‘25 |
|---|---|---|---|---|---|
| BEV | 29,654 | 29,634 | +0.1% | 20.6% | 21.3% |
| HEV | 19,297 | 18,413 | +4.8% | 13.4% | 13.2% |
| PHEV | 18,557 | 12,598 | +47.3% | 12.9% | 9.0% |
| Petrol | 68,757 | 70,075 | -1.9% | 47.7% | 50.3% |
| Diesel | 7,862 | 8,625 | -8.8% | 5.5% | 6.2% |
| Total | 144,127 | 139,345 | +3.4% |
Source: SMMT
Please note: Mild hybrid electric vehicle (MHEV) registrations are included in the petrol and diesel figures.
webuyanycar’s head of technical services, Richard Evans said:
“January’s SMMT figures show electrification continuing to advance, but with growth increasingly led by PHEVs and hybrids rather than BEVs alone. While BEV volumes remained flat, stronger uptake of other electrified powertrains points to a more diversified transition, a dynamic that will be important for manufacturers and the used car market as the ZEV mandate beds in.”
“In practical terms, the data highlights a growing misalignment between ZEV mandate requirements, which are BEV-focused - and current demand patterns, where growth is being absorbed more readily by PHEVs and HEVs.”
“Industry analysis indicates that this imbalance could place pressure on manufacturers to support BEV registrations through pricing and incentives, with potential knock-on effects for residual values and used market stability if supply continues to outpace natural consumer demand.”
New EV market in review: 2025 vs 2024
| Powertrain | 2025 registrations | Market share 2025 | 2024 registrations | Market share 2024 | YoY change |
|---|---|---|---|---|---|
| BEV | 473,348 | 23.4% | 381,970 | 19.6% | +23.9% |
| PHEV | 225,143 | 11.1% | 167,178 | 8.6% | +34.7% |
| HEV | 280,185 | 13.9% | 261,398 | 13.4% | +7.2% |
| Petrol | 937,938 | 46.4% | 1,019,128 | 52.2% | -8.0% |
| Diesel | 103,906 | 5.1% | 123,104 | 6.3% | -15.6% |
| Total | 2,020,520 | 1,952,778 | +3.5% |
Source: SMMT
- Electrified powertrains led market growth in 2025, with BEV registrations up 23.9% YoY and PHEVs rising 34.7% YoY.
- BEV market share increased to 23.4%, while PHEVs reached 11.1%, together accounting for over a third of all new car registrations.
- HEVs recorded steady growth, with registrations up 7.2% YoY and market share edging up to 13.9%.
- Petrol and diesel registrations continued to decline, with petrol down 8.0% YoY and diesel falling 15.6% YoY, reducing their combined market share to just over half of the market.
- Overall, market growth was driven primarily by electrification, confirming the structural shift away from ICE vehicles.
Key EV market developments 2025–26
Discounts for new EV buyers through the Electric Car Grant scheme
- The UK Government’s Electric Car Grant scheme was introduced in July 2025 to make EVs more affordable and encourage widespread adoption.
- The £650 million scheme offers discounts of up to £3,750 on selected new electric cars with a list price of £37,000 or less.
- In some cases, higher-spec versions of the same model can still qualify for the grant, but only if a lower-priced variant of that model meets the £37,000 threshold and the higher trim’s list price does not exceed £42,000.
- As of February 2026, there are 47 eligible EV models, although most are only eligible for the lower £1,500 grant.
- Only eight qualify for the maximum £3,750 grant: the Citroen e-C5 Aircross, Ford Puma Gen-E, Ford E-Tourneo Courier, MINI Countryman Electric, Nissan LEAF, Renault 4, Renault 5 (52kWh), and Renault Alpine A290.
- The Electric Car Grant scheme replaces the original Plug-in Car Grant (PICG), which ran from January 2011 to June 2022, and offered discounts to private and fleet EV buyers.
Budget statement 2025: What does it mean for EVs?
On November 26th, 2025, Chancellor Rachel Reeves confirmed the following tax changes for electric cars in her Budget announcement:
New per-mile tax for EVs and PHEVs from 2028
An additional mileage-based tax for BEVs and PHEVs will start from April 2028. The charges for the 2028/29 tax year are as follows:
- A 3p per mile tax for BEVs. (This equates to around half the fuel duty rate paid by petrol drivers.)
- A lower 1.5p per mile tax will apply to PHEVs.
- The cost per mile will increase each year in line with inflation (CPI).
- An average BEV driver travelling 8,500 miles in 2028/29 will pay an extra £255 in tax.
Increased expensive car supplement threshold from April 2026
The expensive car supplement (ECS) is an additional annual tax, which is currently levied on all cars with a list price of £40,000 or more, including EVs.
It is applied from the second to sixth years of tax registration.
From April 1st 2026, the ECS list price threshold for BEVs will rise from £40,000 to £50,000.
- The ECS will amount to £2,370 in additional tax for a new car bought in the 2025/26 tax year, at an average cost of £474 a year over five years.
- The threshold increase will exclude many new mid-range EVs from the ECS, helping to make electric motoring more affordable to consumers.
Used electric car sales 2025
- The UK’s used car market recorded its third consecutive year of growth in 2025, with total transactions rising 2.2% YoY to 7,807,872 units.
- Used battery electric vehicle (BEV) transactions jumped 45.7% to a record 274,815 units, increasing their market share to 3.5% (up from 2.5% in 2024).
- PHEV sales grew more modestly (up 6.3% to 88,032 units) while hybrid HEVs recorded strong momentum (rising 28.6% to 407,531 transactions).
Electrified vehicles close in on 10% of used car sales
- In 2025, combined sales of electrified used vehicles (BEVs, PHEVs and HEVs) increased 30.9% YoY to 770,378 units.
- This pushed electrified powertrains to 9.9% of all used car transactions by volume.
- Growth was led overwhelmingly by BEVs, reflecting improving affordability.
- This reflects greater supply of ex-fleet and ex-lease EVs entering the used market, improving availability and affordability for private buyers.
Petrol and diesel remain dominant, but electrification advances
- In 2025, petrol remained the most popular fuel type, with 4.56 million used car transactions (achieving a 58.4% market share).
- Diesel transactions fell to 2.45 million units (31.4% market share), continuing its long-term decline as fewer younger diesel cars enter the used market.
- Petrol and diesel transactions combined still accounted for 89.9% of all used car sales, underlining the current dominance of ICE vehicles.
- While ICE cars still dominate by volume, the fuel mix is steadily rebalancing as electrified adoption accelerates.
New car market share by powertrain (2018–2027)
| Year | BEV | HEV | PHEV | Petrol | Diesel |
|---|---|---|---|---|---|
| 2027* | 32.2% | 16.6% | 12.9% | 34.6% | 3.7% |
| 2026* | 28.5% | 14.8% | 12.6% | 40.0% | 4.1% |
| 2025 | 23.4% | 13.9% | 11.1% | 46.4% | 5.1% |
| 2024 | 19.6% | 13.4% | 8.6% | 52.2% | 6.3% |
| 2023 | 16.5% | 12.6% | 7.4% | 56.0% | 7.5% |
| 2022 | 16.6% | 11.6% | 6.3% | 55.9% | 9.6% |
| 2021 | 11.6% | 8.9% | 7.0% | 58.3% | 14.2% |
| 2020 | 6.6% | 6.7% | 4.1% | 62.7% | 19.8% |
| 2019 | 1.6% | 4.2% | 1.5% | 66.0% | 26.6% |
| 2018 | 0.7% | 3.4% | 1.9% | 62.3% | 31.7% |
Source: SMMT
*Forecast figures for 2025–2027 are taken from the SMMT’s January 2026 new car and van outlook.
SMMT’s new car outlook explained
2025 overview
- The UK new car market surpassed 2 million registrations in 2025, reaching approximately 2.02 million units, the first time this has happened since 2019, driven by growth in electrified vehicles and fleet demand.
- BEVs are expected to achieve a market share of roughly 23.4%, reflecting a continued strong uptake but still falling short of the Government’s 2025 ZEV mandate target of 28%.
- HEVs and PHEVs continued to grow, together capturing a larger proportion of the new car market and narrowing the share gap with traditional ICE vehicles.
- Meanwhile, petrol and diesel shares declined further in volume and proportion, reflecting ongoing shifts toward electrified powertrains.
2026 outlook
- The SMMT projects total new car sales in 2026 to rise modestly to around 2.048 million units, which would mark a 1.4% increase from 2025.
- BEVs are forecast to grow significantly, increasing their market share to ~28.5% as the sector benefits from broader model choice, incentives like the Electric Car Grant, and fleet electrification.
- PHEVs are expected to command around 12.6%, and HEVs around 14.8%, maintaining strong positions in a diversifying powertrain mix.
- Petrol market share is projected to slip to around 40%, while diesel’s decline is expected to reach approximately 4.1%.
2027 outlook
- The new car market is forecast to grow 1.3%, reaching 2.058 million units.
- BEV registrations are projected to increase 15.6%, taking its market share to 32.2%.
- PHEVs are expected to rise 8.3%, achieving a 12.9% market share, and HEVs to grow 9%, reaching a 16.6% market share.
- Finally, petrol registrations are predicted to fall by 12.3% to a 34.6% market share, and diesel by 13.8% to a 3.7% share.
webuyanycar’s head of technical services, Richard Evans said:
“The SMMT’s January 2026 outlook points to a more resilient UK new car market than earlier in 2025, with registrations once again exceeding two million units as demand continues to recover and Government support measures underpin confidence.”
“While EV uptake showed some volatility at the start of 2026, following a strong late-2025 performance, the overall trajectory remains upward, with BEVs expected to account for an increasing share of registrations over the year.”
“Nevertheless, internal combustion engines, particularly petrol, are set to retain a substantial presence in the near term, highlighting the transitional nature of the market as consumers and fleets continue to adopt a broad mix of powertrains.”
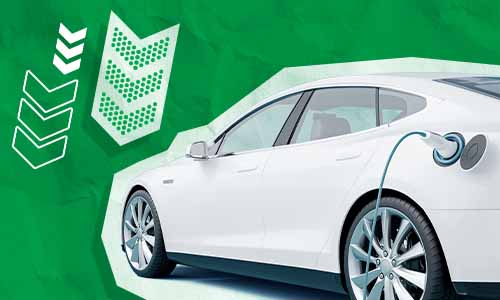
Resale values of used EVs
In August 2025, webuyanycar published new data about the average depreciation rates for EVs. This graph shows how the average EV’s depreciation curve compares to other powertrains:
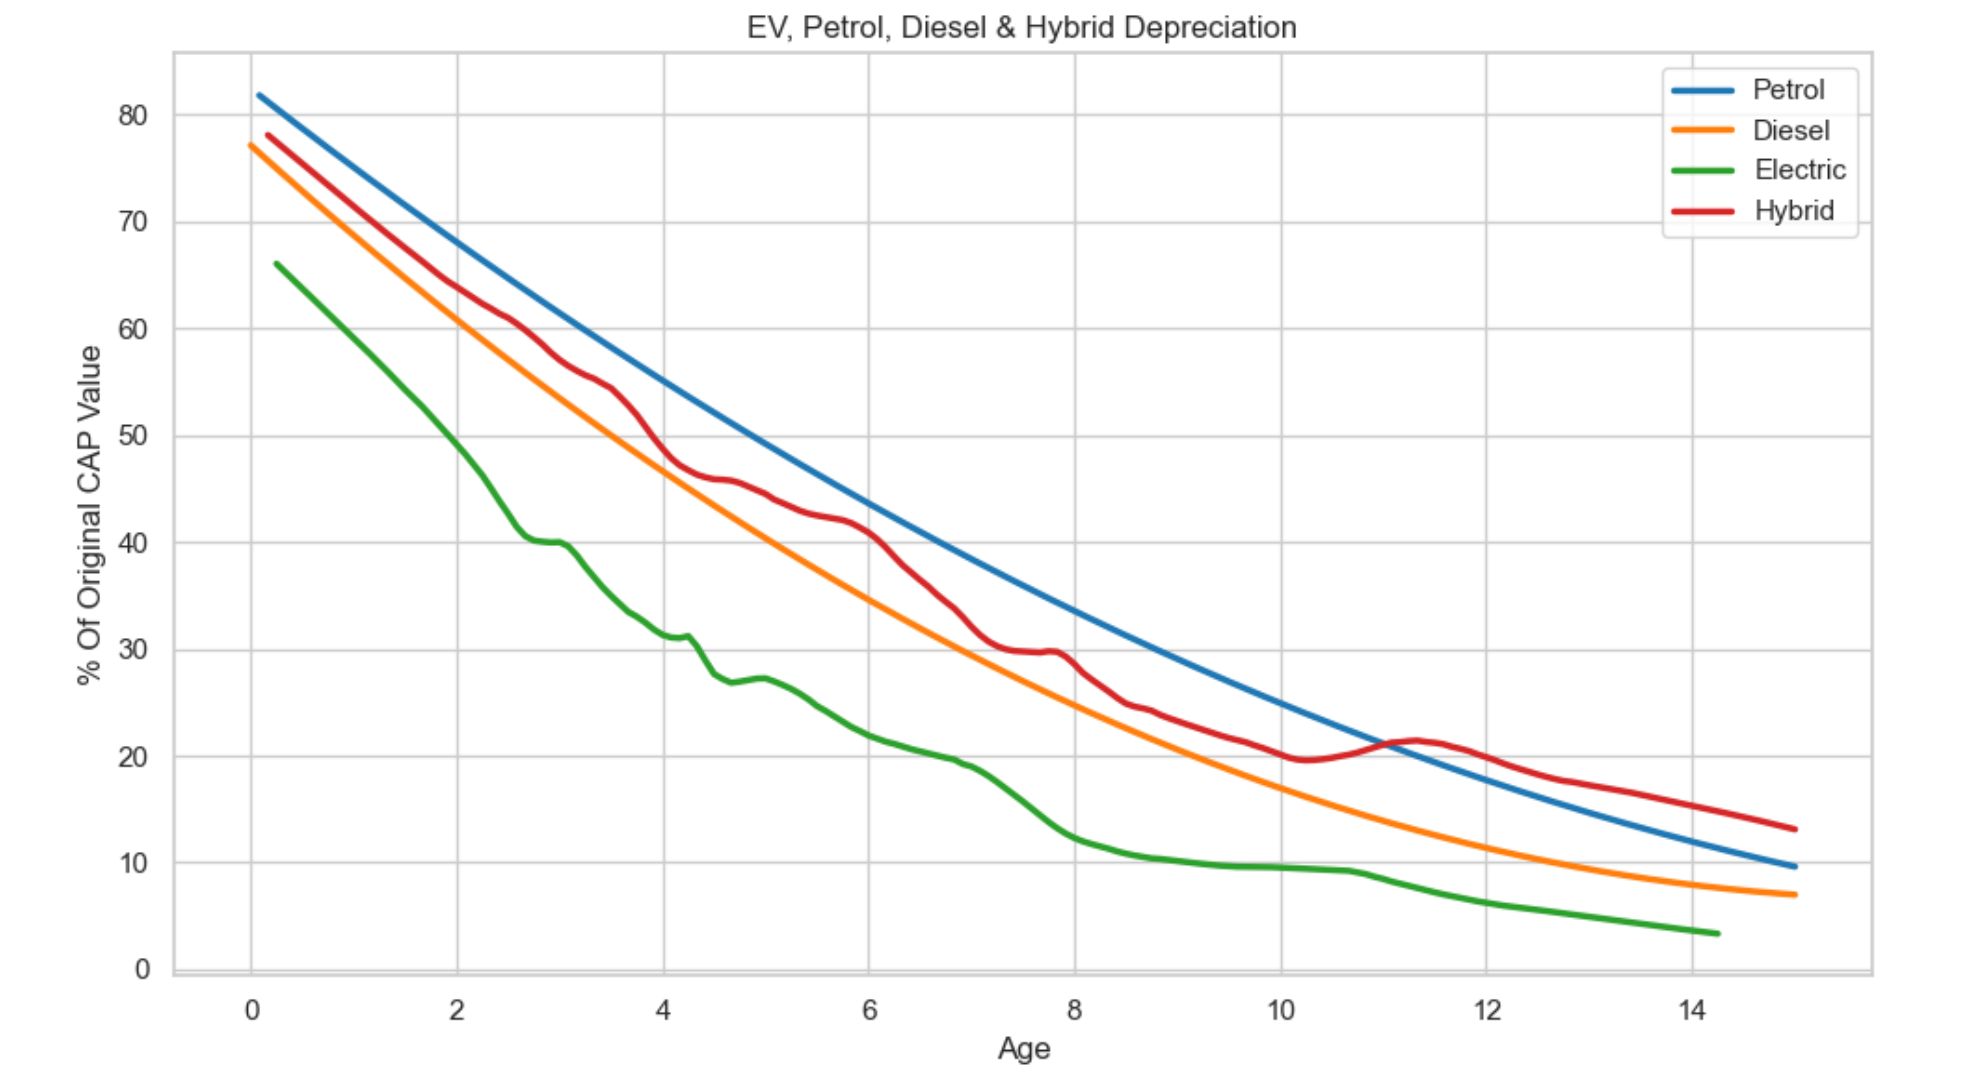
*Disclaimer: Webuyanycar are not predicting future increases or decreases in your car’s market value. Changes in value can occur due to a variety of factors, including the vehicle’s age, mileage, condition, and the level of market demand. Learn more about what affects car value.
Source: webuyanycar
Key findings
- On average, EVs lose approximately 40% of their value after one year and around 50% after two years.
- Petrol, diesel, and hybrid cars retain over 65% of their value at one year and over 60% at two years.
- EVs consistently depreciate faster than other fuel types, with the gap gradually narrowing after the eight-year mark.
- EVs with strong brand reputations, better performance, and higher ranges tend to hold their value better than average.
How has the UK’s new EV market share grown over time?
- In 2016, BEVs accounted for just 1.4% of all new vehicle registrations.
- In 2024, BEVs secured a record 19.6% market share, and PHEVs made up a further 8.6% of registrations, bringing the total market share for plug-in vehicles to 28.2%.
- The number of annual BEV registrations grew over 10x from 36,907 in 2016 to 381,970 in 2024.
- The SMMT’s January 2026 forecast predicts 584,000 BEV registrations in 2026, which would mark an increase of over 15x from 2016’s total!
How many BEVs are there in the UK?
At the end of January 2026, there were over 1.85 million BEVs on the UK roads, representing around 5.4% of the UK’s 34 million car parc!
Source: Zapmap
EV chargepoint availability report
EV chargepoint growth trends 2020–2026
Between January 2020 and January 2026, the number of public EV charging devices in the UK grew from 16,505 to 88,513 – an increase of 436%.
Source: Zapmap
Public charger speeds: Shifting expectations
As EVs with increasingly faster charging capabilities have hit the market, expectations for public charging speeds have also risen - and the UK’s network is expanding to meet that demand.
EV chargepoint availability report
At the end of January 2026, there were 88,513 public EV chargepoints in the UK, across 45,242 locations.
In January, 717 net new charging devices were installed.
Growth in rapid and ultra-rapid devices
- As of January 2026, there were 18,077 Rapid or Ultra-rapid devices (50kW+), across 6,673 locations.
- Across 2025, 3,464 Rapid/Ultra-rapid devices were added in total (a 24% increase from the end of 2024).
- Ultra-rapid (150kW+) growth was also particularly strong, with 2,872 installed in 2025.
- At the end of January 2026, there were 9,990 Ultra-rapid chargers (40% more than in January 2025).
Source: Zapmap
Leading EV chargepoint providers
- At the end of January 2026, Shell Recharge Ubitricity had the most public chargepoints, with 11,959 devices, accounting for 13.5% of the UK’s public charger network.
- Connected Kerb and Pod were the next largest providers with 6,979 (7.8%) and 5,180 devices (5.9%) respectively.
Source: Zapmap
EV battery innovations
Toyota solid state tech could achieve 40-year battery lifespan
Toyota’s upcoming solid‑state battery claims a 40‑year lifespan, retaining around 90% capacity after that time. It promises faster charging, lighter weight, and improved safety over the current lithium‑ion packs.
Tesla’s ‘Tera-Cell’ could redefine EV range and charging
Tesla’s ‘Tera‑Cell’ battery aims for a 600+ miles range and an 80% charge under 15 minutes. Boasting 40% higher energy density, it could transform how EVs (and even flying cars) handle range and charging.
Huawei solid-state battery could unlock 1,800+ mile range
Huawei’s solid‑state battery technology could deliver up to 1,860-miles and a full recharge in five minutes. This is made possible by a nitrogen‑doped sulfide electrolyte delivering 400–500 Wh/kg. However, some commercialisation challenges remain.
Different types of EVs
Here is a quick explainer on the various types of EV on the market:
Battery Electric Vehicles (BEVs)
Unlike the other hybrid variants on the market, BEVs are powered solely by an electric battery. Most BEVs have electric ranges between 100-300 miles.
(Whilst 200 miles or above is broadly considered a good range, a range of 100 miles may be sufficient depending on your daily commute.)
Plug-in Hybrid Electric Vehicles (PHEVs)
PHEVs combine a petrol or diesel engine with a smaller electric battery, typically offering 15-40 miles of electric range.
Some premium models provide longer ranges, such as the Toyota RAV4 PHEV (46 miles), BMW 2 Series 225e (56 miles), Mercedes GLE 350de (66 miles), and Polestar 1 (93 miles). Like BEVs, PHEVs can be plugged in to recharge their batteries.
Mild hybrid electric vehicles (MHEVs)
A mild hybrid electric vehicle (MHEV) combines a combustion engine with a small electric battery that assists the engine but cannot power the car alone.
It doesn’t need charging, as braking recovers energy to the battery. MHEVs improve fuel efficiency slightly over conventional cars but are more expensive to run than other electrified vehicles.
Fuel cell electric vehicles (FCEVs)
Fuel cell electric vehicles (FCEVs) use hydrogen to generate electricity, emitting only water vapour. They refuel in about five minutes and offer 300-400 miles of range but are less efficient than battery EVs, converting only 40-60% of fuel energy.
High costs and limited charging infrastructure have hindered growth, with just 300 FCEVs on UK roads and 15 hydrogen refuelling stations in the UK (with around six open to the public).
How do EVs work?
EVs are powered by one or more electric motors rather than an ICE engine. These motors are powered by a rechargeable battery, which can be replenished by plugging the vehicle into an electric charger.
What factors affect EV performance?
Your real-world electric range may differ from the advertised figure (which often reflects a best-case scenario). Factors that affect EV performance include your driving style, weather conditions - and the degree to which features such as the in-car heating and air conditioning are used.
Smart energy recovery technology
EVs utilise technology that converts kinetic energy into electricity whilst braking or travelling uphill, automatically topping up the battery.